Introduction
Kidney transplantation is now the first-line treatment for different forms of end-stage renal failure, according to the international medical community. Optimized immunosuppressive regimens and new immune detection technologies have significantly improved the short-term outcomes of transplant recipients after surgery.
But there are still no effective methods for immune system function monitoring in patients after kidney transplantation, resulting in many blind spots in the clinical application of immunosuppressive agents. A single-cell cytometry by time-of-flight (CyTOF) was used to detect peripheral blood immune cells in kidney transplant recipients (KTRs) to compare the immune status of the recipient’s whole peripheral blood before and after receiving immunosuppressive agents.
The immune cell types of the KTRs before and after receiving immunosuppressive drugs were largely classified into CD4+ T cells, CD8+ T cells, B cells, NK cells/T cells, monocytes/macrophages, granulocytes, and dendritic cells, according to CyTOF analysis (DCs). KTRs’ peripheral blood had considerably elevated levels of CD57+NK cells and dramatically lower levels of central memory CD4+ T cells, follicular helper CD4+ T cells, effector CD8+ T cells, effector memory CD8+ T cells, and naïve CD8+ T cells after undergoing immunosuppressive treatment.
This study used CyTOF to classify immune cells in the peripheral blood of KTRs before and after immunosuppressive treatment and provided relatively accurate information for assessment and treatment strategies for KTRs.
Methods
In total, 5 KTR patients were included in this study, and their peripheral blood samples were collected before and after immunosuppressive therapy after kidney transplantation. CyTOF analysis was performed according to a previously described protocol. CyTOF analysis was used to detect immune cells in peripheral blood samples, and 40 immune cell-related markers were included in this analysis.
MATLAB was used to remove the influence of noise from batches, and obtain the effective data of live single immune cells for the next analysis. vi-SNE plots were generated by the t-distribution random neighborhood embedding (t-SNE) algorithm, and CD45+ cells were clustered to analyze the differences in phenotype and relative content of different cell subpopulations. In addition, the SPADE algorithm was used to analyze the expression patterns of immune cells in different groups and classify these cells by hierarchical clustering.
A paired Mann–Whitney U test was applied to compare differences between various immune cell subgroups in the peripheral blood of KTRs before and after immunosuppressive treatment, and the data were analyzed using R software. A two-sided P <0.05 was considered statistically significant.
Results
Immune Cells in the Peripheral Blood of KTRs
According to the immune cell markers, CD45+ cells were divided using the manual gated circle function of the Cytobank platform (Table 1). vi-SNE is a bioinformatic analysis method based on t-SNE.

The relative content of monocytes/macrophages in the posttreatment group was significantly higher than that in the pretreatment group (P <0.05).
ROC analysis showed that the application of CD4+ T cells, monocytes/macrophages or NK cells/γδ T cells was the strongest for predicting the efficacy of immunosuppressive agents in the pretreatment and posttreatment groups.
Differences in CD4+ T Cells Between Pretreatment and Posttreatment
To explore the differences in CD4+ T cells between pretreatment and posttreatment in the KTRs, we further reclustered the CD4+ T cells.
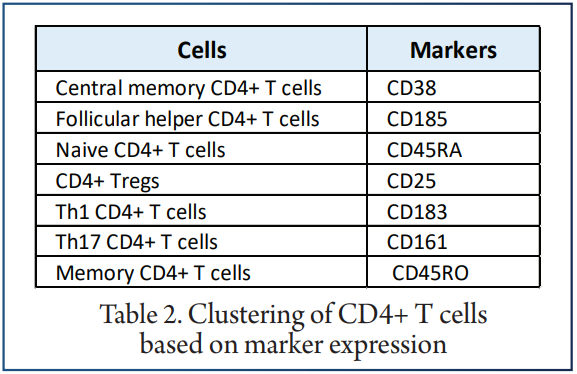
We used the SPADE algorithm to perform hierarchical clustering of CD4+ T cells based on marker expression. The difference in the content of CD4+ T cell subsets in the peripheral blood of patients between the pretreatment and posttreatment groups were compared.
It was found that, compared with the pretreatment group, the central memory CD4+ T cell and follicular helper CD4+ T cell levels in the posttreatment group were significantly downregulated (P <0.05). ROC analysis indicated that central memory CD4+ T cells best predicted the pretreatment and posttreatment groups.
Differences in NK Cells/γδ T Cells Between Pretreatment and Posttreatment
vi-SNE analysis showed that NK cells/γδ T cells were divided into CD38+ NK cells.
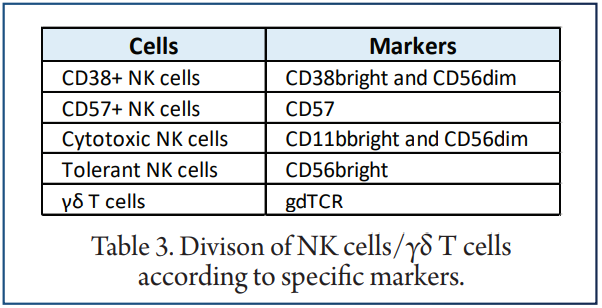
The expression levels of the above unique markers in the pretreatment and posttreatment groups were visualised. We found that CD57+ NK cells were significantly downregulated in the posttreatment group compared with the pretreatment group (P <0.05). In contrast, the content of tolerant NK cells was significantly increased after treatment (P <0.05). ROC analysis showed that CD57+ NK cells best predicted the efficacy of immunosuppressive agents before and after treatment.
Differences in Dendritic cells (DCs) between Pretreatment and Posttreatment
To analyze the differences in DCs before and after treatment with immunosuppressive agents in the KTRs, DCs were re-clustered into 2 cell subgroups.
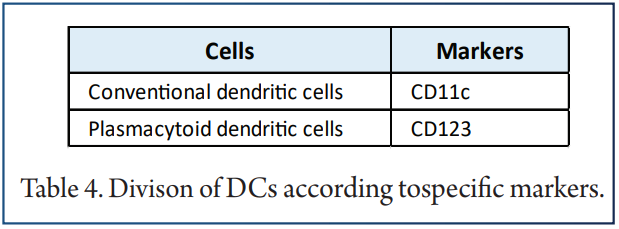
Next, we compared the relative abundances of DC subgroups in the peripheral blood of patients before and after treatment and found that there were no significant changes in DC subgroups in the peripheral blood of patients before and after treatment.
The expression patterns of DC subgroups in the peripheral blood of patients before and after treatment were also different . ROC analysis showed that pDCs strongly predicted the efficacy of immunosuppressive agents before and after treatment.
Differences in B Cells Between Pretreatment and Posttreatment
According to differences in the expression of B cell markers, vi-SNE to recluster B cells and divided them into 5 cell subgroups.
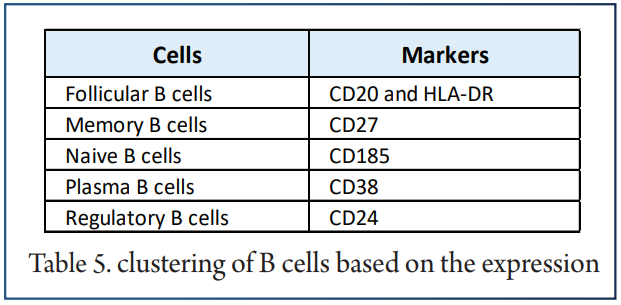
The SPADE algorithm was applied to perform hierarchical clustering of B cells based on the expression of markers. Then, we visualized the expression of the above immune cell markers in the pretreatment and posttreatment groups. The bar plot shows that KTRs harbored relatively different proportions of B cell subgroups.
Next, we compared the relative abundances of B cell subpopulations in the peripheral blood of patients between the pretreatment and posttreatment groups and found that, compared with the posttreatment group, the peripheral blood of the pretreatment group had an increased level of memory B cells (P <0.05).
Discussion
Related to the long-term functional and stable survival of grafts after kidney transplantation, reducing or removing immunosuppressive agents as much as possible and inducing transplant tolerance are research hotspots in the field of kidney transplantation, and they are also the goals of transplant doctors.
Although the short-term survival rate after kidney transplantation has improved significantly in recent years, long-term survival remains a problem in the transplant community.
T cells can be divided into CD4+ T cells, CD8+ T cells and Treg cells according to their function.
The study compared the function of follicular helper T cells in the blood between patients with operative tolerance and patients with stable graft function. Subgroup analysis showed that the proportions of central memory CD4+ T cells and follicular helper CD4+ T cells in the peripheral blood of the posttreatment group were reduced compared with those in the pretreatment group.
CD8+ T lymphocytes can specifically recognize the transplanted kidney. We found that patients receiving immunosuppressive therapy after kidney transplantation had relatively few effector CD8+ T cells and effector memory CD8+ T cells in their peripheral blood. Therefore, the relative proportions of some CD8+ T cell subgroups (such as effector CD8+ T cells and effector memory CD8+ T cells) decreased after receipt of immunosuppressive agents.
Conclusions
In this study, CyTOF was used to classify immune cells in the peripheral blood of KTRs before and after receipt of immunosuppressive agents. The differences in the proportions of the main immune cells and immune cell subgroups were further compared between pretreatment and posttreatment groups. We found that the abundances of activated immune cell subsets in the peripheral blood of patients after receipt of immunosuppressive therapy and the proportion of tolerant immune cells were increased in the posttreatment group.
References
1. Galliford J, Game DS. Modern renal transplantation: present challenges and future prospects. Postgrad Med J (2009) 85:91–101. doi: 10.1136/pgmj.2008.070862
2. Liu Y, Hu J, Liu D, Zhou S, Liao J, Liao G, et al. Single-cell analysis reveals immune landscape in kidneys of patients with chronic transplant rejection. Theranostics
(2020) 10:8851–62. doi: 10.7150/thno.48201
3. Liu Y, Zhou S, Hu J, Xu W, Liu D, Liao J, et al. Characterization of aberrant pathways activation and immune microenviroment of BK virus associated nephropathy.
Aging (Albany NY) (2020) 12:14434–51. doi: 10.18632/aging.103486
4. Papp G, Boros P, Nakken B, Szodoray P, Zeher M. Regulatory immune cells and functions in autoimmunity and transplantation immunology. Autoimmun Rev
(2017) 16:435–44. doi: 10.1016/j.autrev.2017.03.011
5. Wekerle T, Segev D, Lechler R, Oberbauer R. Strategies for long-term preservation of kidney graft function. Lancet (London England) (2017) 389:2152–62. doi:
10.1016/S0140-6736(17)31283-7
6. Braza F, Dugast E, Panov I, Paul C, Vogt K, Pallier A, et al. Central Role of CD45RA- Foxp3hi Memory Regulatory T Cells in Clinical Kidney Transplantation Tolerance. J Am Soc Nephrol (2015) 26:1795–805. doi: 10.1681/ASN.2014050480
7. Becker LE, de Oliveira Biazotto F, Conrad H, Kihm LP, Gross-Weissmann ML, Waldherr R, et al. Cellular infiltrates and NFκB subunit c-Rel signaling in kidney allografts of patients with clinical operational tolerance. Transplantation (2012) 94:729–37. doi: 10.1097/TP.0b013e31826032be
8. Nova-Lamperti E, Chana P, Mobillo P, Runglall M, Kamra Y, McGregor R. Increased CD40 Ligation and Reduced BCR Signalling Leads to Higher IL-10 Production in B Cells From Tolerant Kidney Transplant Patients. Transplantation (2017) 101:541–7. doi: 10.1097/TP.0000000000001341
9. Spitzer MH, Nolan GP. Mass Cytometry: Single Cells, Many Features. Cell (2016) 165:780–91. doi: 10.1016/j.cell.2016.04.019
10. Li Y, Wang Y, Yao Y, Griffiths BB, Feng L, Tao T, et al. Systematic Study of the Immune Components after Ischemic Stroke Using CyTOF Techniques. J Immunol
Res (2020) 2020:9132410. doi: 10.1155/2020/9132410
11. Hawley D, Ding J, Thotakura S, Haskett S, Aluri H, Kublin C, et al. RNA-Seq and CyTOF immuno-profiling of regenerating lacrimal glands identifies a novel subset of cells expressing muscle-related proteins. PloS One (2017) 12:e0179385. doi: 10.1371/journal.pone.0179385
12. Oh C-K, Bang JB, Kim S-J, Huh KH, Kim SJ, Jeon JS, et al. Improvement of medication adherence with simplified once-daily immunosuppressive regimen in stable kidney transplant recipients: A prospective cohort study. Asian J Surg (2020) 43:660–7. doi: 10.1016/j.asjsur.2019.07.011
13. Han G, Spitzer MH, Bendall SC, Fantl WJ, Nolan GP. Metal-isotope-tagged monoclonal antibodies for high-dimensional mass cytometry. Nat Protoc (2018)
13:2121–48. doi: 10.1038/s41596-018-0016-7
14. Finck R, Simonds EF, Jager A, Krishnaswamy S, Sachs K, Fantl W, et al. Normalization of mass cytometry data with bead standards. Cytometry A (2013)
83:483–94. doi: 10.1002/cyto.a.22271
15. Chen TJ, Kotecha N. Cytobank: providing an analytics platform for community cytometry data analysis and collaboration. Curr Top Microbiol Immunol (2014)
377:127–57. doi: 10.1007/82_2014_364
16. Anchang B, Hart TDP, Bendall SC, Qiu P, Bjornson Z, Linderman M, et al. Visualization and cellular hierarchy inference of single-cell data using SPADE. Nat
Protoc (2016) 11:1264–79. doi: 10.1038/nprot.2016.066
17. Song C-B, Zhang L-L, Wu X, Fu YJ, Jiang YJ, Shang H, et al. CD4(+)CD38(+) central memory T cells contribute to HIV persistence in HIV-infected individuals on long-term ART. J Transl Med (2020) 18:95. doi: 10.1186/s12967-020-02245-8
18. Kadivar M, Petersson J, Svensson L, Marsal J. CD8αβ+ γδ T Cells: A Novel T Cell Subset with a Potential Role in Inflammatory Bowel Disease. J Immunol (2016) 197:4584–92. doi: 10.4049/jimmunol.1601146


