Introduction
Anemia is a well-known consequence of CKD, It is linked to structural and functional changes in the myocardium, raising the risk of cardiovascular morbidity and death in this group. Current anaemia monitoring guidelines for HD patients call for haemoglobin monitoring every 2 to 4 weeks, which necessitates frequent blood drawing, which leads to anaemia. Thus, for the HD population, an on-line monitoring approach of anaemia and iron levels might be clinically useful and patient-friendly, since it would eliminate the need for regular blood collection while still providing vital information about the patients’ condition.
Anemia in hemodialysis patients was detected using NIR spectroscopy and machine learning. The goal of this study was to assess the correlation between the spectrum of spent dialysate in the wavelength range of 700–1700 nm and the levels of haemoglobin (Hb), red blood cells (RBC), hematocrit (Hct), iron (Fe), total iron binding capacity (TIBC), ferritin (FER), mean corpuscular volume (MCV), and mean corpuscular hematocrit (MCH).
The observed high correlations between the NIR spectrum of the dialysate fluid and the study variables act as a promising method for on-line monitoring of anemia and iron saturation parameters in HD patients.
Methods
Samples of spent dialysis fluid were collected from 35 maintenance HD patients, of whom 9 were treated with hemofiltration (HDF) and 26 with high-flux HD. Ultraviolet–Visible-Near infrared (UV–VIS–NIR) optical absorption spectra of the spent dialysate have been registered using the spectrometer Lambda 950 (PerkinElmer CA, USA).
The wavelength region of interest was 700–1700 nm, and the resolution was set to 2 nm. The optical path-length was 1 mm. Complete blood count and all related variables were determined by fluorescent How cytometry. Mathematical pre-processing such as scatter correction and derivatives has been investigated and the best one was selected on the basis of the lowest standard error and highest coercient of determination. The best results have been obtained with the Standard Normal Variate (SNV) technique.
NIR absorption values were implemented into the ANN (articial neural network) algorithm. Here, in order to form the ANN and perform its training, the MATLAB Neural Net Fitting tool (nftool) was used. The NIR spectrum of the spent dialysis fluid is used as input, while the red blood parameters were taken as output. The data are randomly divided into two groups: 85% of data is used for training and the remaining 15% is used for testing.
Results
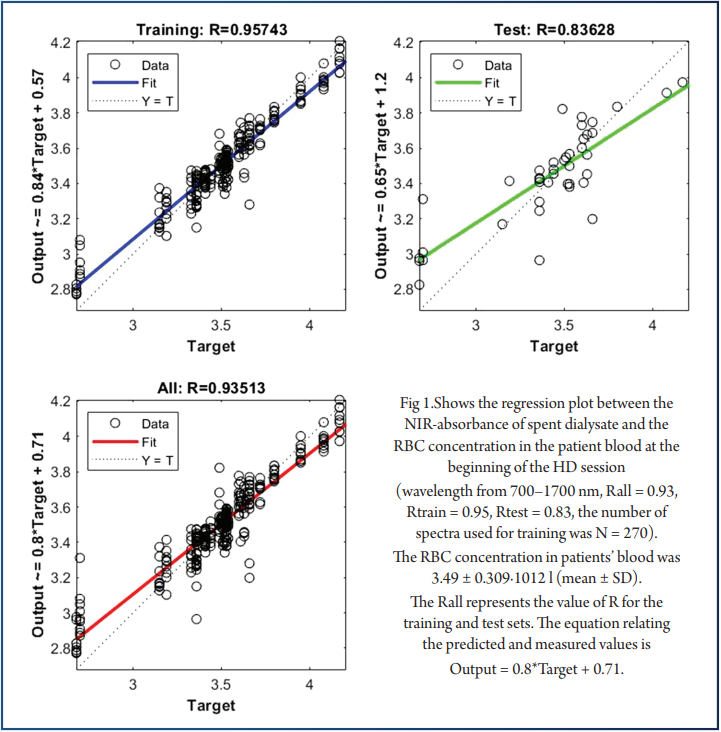
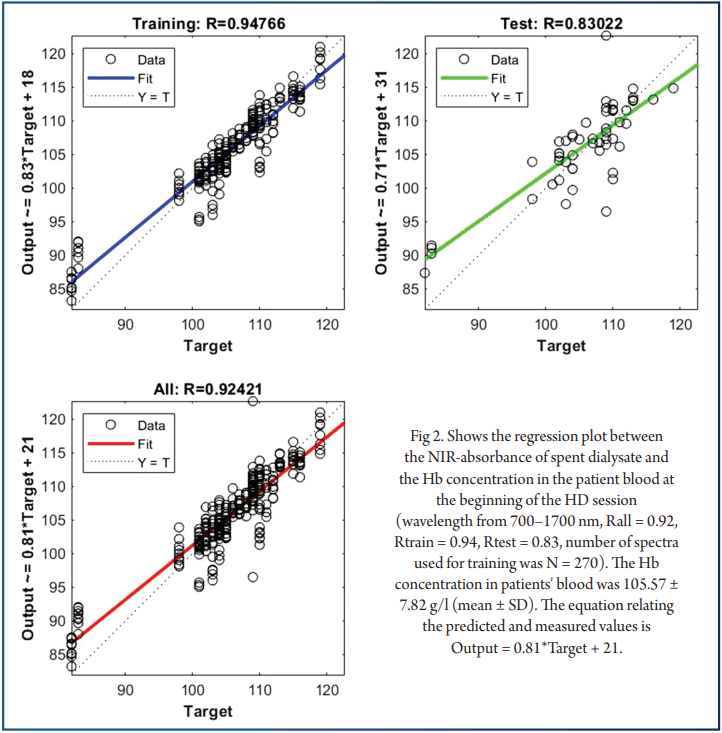
The following regression plots display the network outputs with respect to targets for training and test sets (Figs. 1, 2). For a perfect fit, the data should fall along the 45-degree dashed line, where the network outputs are equal to the targets. The data points are represented with circles. The R value is an indication of the relationship between the neural network outputs and targets. The correlation coefficient (R-value) measures the correlation between outputs and targets. Correlation was considered perfect if R was = 1 (there is an exact linear relationship between outputs and targets), very strong if R was > 0.90 and < 1, moderate if R was > 0.60 and < 0.80, and fair if R was < 0.6023. If R is close to zero, no linear relationship between outputs and targets exists.
Results
Similarly correlation between the spectrum of spent dialysate in the wavelength range of 700–1700 nm and the levels of hematocrit (Hct), iron (Fe), total iron binding capacity (TIBC), ferritin (FER), mean corpuscular volume (MCV) and mean corpuscular hemoglobin concentration (MCHC) in patient blood were checked. The obtained correlation coeffcient (R) for RBC was 0.93, for Hb 0.92, for Fe 0.94, for TIBC 0.96, for FER 0.91, for Hct 0.94, for MCV 0.92, for MCHC 0.92 and for MCH 0.93.
The observed high correlations between the NIR spectrum of the dialysate fluid and the levels of the studied variables support the use of NIRS as a promising method for on-line monitoring of anemia and iron saturation parameters in HD patients.
Conclusion
In this work, a new approach combining ML and NIR scanning of the spent dialysis fluid has been proposed to enable fast, on-line evaluation of anemia in maintenance HD patients without the necessity of blood sampling. Neural networks have demonstrated a remarkable effectiveness in terms of effciency (training time) and performance. It has been shown that the accuracy and precision of the proposed method for indirect determining the concentration of blood substituents can provide useful diagnostic screening information.
References
1. Hill, N. R. et al. Global prevalence of chronic kidney disease-A systematic review and meta-analysis. PLoS ONE 11(7), e0158765 (2016).
2. Liyanage, T. et al. Worldwide access to treatment for end-stage kidney disease: A systematic review. Lancet 385(9981), 1975–1982 (2015).
3.mRigao, C. & Parfrey, P. Therapy insight: Management of cardiovascular disease in the renal transplant recipient. Nat. Clin. Pract. Nephrol. 2(9), 514–526 (2006).
4. Wintrobe, M. M. 1 Wintrobe’s Clinical Hematology (Lippinco Williams & Wilkins, 2008).
5. Babu, A.S.K.K., Heber, A. Iron Status of Pregnant Women and Their Newborns Using a Combination of Hematologic and Biochemical Parameters for the Diagnosis of Iron Deffciency. (2018).
6. Gaweda, A. E. et al. Markers of iron status in chronic kidney disease. Hemodial. Int. 21, S21-27 (2017).
7. Daru, J. et al. Serum ferritin as an indicator of iron status: What do we need to know?. Am. J. Clin. Nutr. 106(suppl 6), 1634S-1639S (2017).
8. Group, Kidney Disease: Improving Global Outcomes (KDIGO) Anemia Work. KDIGO clinical practice guideline for anemia in chronic kidney disease. Kidney Int. Suppl. 2(4), 279–335 (2012).
9. Gaweda, A. E. et al. Determining optimum hemoglobin sampling for anemia management from every-treatment data. Clin. J. Am. Soc. Nephrol. 5(11), 1939–1945 (2010).
10. Fridolin, I., Magnusson, M. & Lindberg, L.-G. On-line monitoring of solutes in dialysate using absorption of ultraviolet radiation: Technique description. Int. J. Artif. Organs 25(8), 748–761 (2002).
11. Fridolin, I., Magnusson, M., Lindberg, L-G. Measurement of solutes in dialysate using UV absorption. In: Optical Diagnostics and Sensing of Biological Fluids and Glucose and Cholesterol Monitoring. 40–48 (International Society for Optics and Photonics, 2001).
12. Henn, R. et al. Hemodialysis monitoring using mid-and near-infrared spectroscopy with partial least squares regression. J. Biophoton. 11(7), e201700365 (2018).
13. Koschinsky, T. & Heinemann, L. Sensors for glucose monitoring: Technical and clinical aspects. Diabetes Metab. Res. Rev. 17(2), 113–123 (2001).
14. Catterty, M.S., Cionek, S.P. Analyte System and Method for Determining Hemoglobin Parameters in Whole Blood. (2019).
15. Chung, H., Arnold, M. A., Rhiel, M. & Murhammer, D. W. Simultaneous measurement of glucose and glutamine in aqueous solutions by near infrared spectroscopy. Appl. Biochem. Biotechnol. 50(2), 109–125 (1995).
16. Riley, M. R. et al. Simultaneous measurement of glucose and glutamine in insect cell culture media by near infrared spectroscopy. Biotechnol. Bioeng. 55(1), 11–15 (1997).
17. Maruo, K. et al. Noninvasive blood glucose assay using a newly developed near-infrared system. IEEE J. Sel. Top. Quantum Electron. 9(2), 322–330 (2003).
18. Yamakoshi, Y. et al. A new non-invasive method for measuring blood glucose using instantaneous ditterential near infrared spectrophotometry. In 2007 29th Annual International Conference of the IEEE Engineering in Medicine and Biology Society 2964–2967 (IEEE, 2007).
19. Jerotskaja, J. et al. Optical online monitoring of uric acid removal during dialysis. Blood Purif. 29(1), 69–74 (2010).
20. Xiaobo, Z. et al. Variables selection methods in near-infrared spectroscopy. Anal. Chim. Acta 667(1–2), 14–32 (2010).
21. Alsheref, F.K., Gomaa, W.H. Blood diseases detection using classical machine learning algorithms. Blood 10(7) (2019).
22. Martínez-Martínez, J. M. et al. Prediction of the hemoglobin level in hemodialysis patients using machine learning techniques. Comput. Methods Programs Biomed. 117(2), 208–217. https://doi.org/10.1016/j.cmpb.2014.07.001 (2014).
23. Chan, Y. H. Biostatistics 104: Correlational analysis. Singap. Med. J. 44(12), 614–619 (2003).
24. Zornoza, R. et al. Near infrared spectroscopy for determination of various physical, chemical and biochemical properties in mediterranean soils. Soil Biol. Biochem. 40(7), 1923–1930 (2008).
25. Pasquini, C. Near infrared spectroscopy: A mature analytical technique with new perspectives–A review. Anal. Chim. Acta 1026, 8–36 (2018).
26. Karabchevsky, A. Method and Device for Near-Infrared Spectroscopy (2019).
27. Siesler, H. W., Ozaki, Y., Kawata, S. & Heise, H. M. Near-Infrared Spectroscopy: Principles (Wiley, 2008).
28. Meinke, M. C., Müller, G. J., Helfmann, J. & Friebel, M. Optical properties of platelets and blood plasma and their inffuence on the optical behavior of whole blood in the visible to near infrared wavelength range. J. Biomed. Opt. 12(1), 14024 (2007).
29. Friebel, M., Helfmann, J., Netz, U. J. & Meinke, M. C. Inttuence of oxygen saturation on the optical scaffering properties of human red blood cells in the spectral range 250 to 2000 Nm. J. Biomed. Opt. 14(3), 34001 (2009).
30. Kuenstner, J.T. Method for Noninvasive (in-Vivo) Total Hemoglobin, Oxyhemogolobin, Deoxyhemoglobin, Carboxyhemoglobin and Methemoglobin Concentration Determination. (1997)


