Introduction
Aplastic anemia (AA) is an auto-activated T cell-mediated bone marrow failure. Cyclosporine is often used to treat non-severe AA, but the response rate is only 50%. To better predict response to cyclosporine and pinpoint who is the appropriate candidate, we performed phenotypic and functional T cell immune signature at single cell level by mass cytometry. We found an increase of cytotoxic T lymphocyte antigen 4 (CTLA-4) on T cells and a lower level of CTLA-4 on CD8+ T cells was correlated to hematologic response. Additionally, decreased expression of sphingosine- 1-phosphate receptor 1 (S1P1) on naive T cells and lower levels of interleukin-9 (IL-9) on T helpers also predicted a better response. Collectively, this study suggests that immune signature analysis of T cell by mass cytometry is a useful tool to make a strategic decision on cyclosporine treatment of AA.
Materials and methods
Patients’ and healthy donors’ samples
A total of thirty patients with acquired non-SAA from Institute of Hematology and Blood Diseases Hospital were enrolled in the study.
Inclusion criteria were predefined as follows:
(1) meet the international study group criteria for AA ;
(2) did not meet the criteria of SAA; and
(3) obtained consent to cyclosporine.
Exclusion criteria were defined as
(1) inherent bone marrow failure;
(2) suffer from other hematological disorders or autoimmune diseases;
(3) received an immunosuppressive agent before; and
(4) suffer fever or infection within 4 weeks before diagnosis.
Based on disease severity, patients were classified into transfusion dependent (defined as red blood cell or platelet transfusion dependence or neutrophil count < 0.5 × 10⁹/L), transfusion independent (defined as transfusion dependent or transfusion independent), and complete response (CR). Four healthy males were enrolled, with the median age of 44.5 years old (range from 16 to 50 years old). Routine blood tests were done before collecting bone samples. Bone marrow specimens were collected from participants including AA patients and healthy volunteers.
Mass cytometry staining & acquisition
A panel of antibodies based on surface and intracellular markers was designed for data acquisition. Forty-one bone marrow samples were tested, including thirty of patients without any treatment, seven of post cyclosporine, and four healthy individuals. After 72-h stimulation with phorbol myristate acetate and ionomycin, cells were collected and stained with metal-tagged antibodies. Cisplatin solution staining was used for identifying dead cells. After stating with metal-coupled surface antibody cocktail, nuclear antigen staining was added for fixation and permeabilization. 1.6% paraformaldehyde was used to fix cells, and 1 mL of intercalation solution was added for each sample. EQ beads were added prior to data acquisition. Data was exported in a format of flow cytometry file for further analysis.
Statistical analysis
All analyses were performed using Cytobank software and Prism 8.0.1. Data were presented as median or mean ± standard error mean (SEM). Mann–Whitney test and t test were used for assessing the significance of differences. It was considered to be statistically significant with the value of p < 0.05.
Results
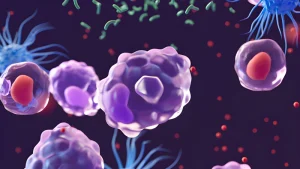
T cell subsets and key transcription factor analyses in AA patients The cohort of 30 non-SAA patients was obtained from medical records. The median age of the cohort was 32 years old, and 56.7% was male. Twenty percent of patients were dependent on red blood cell or platelet transfusion. Fifteen patients (50%) respond to 6-month oral cyclosporine treatment. The frequency of sixteen T cell subsets between patients and healthy individuals was compared, with a non-significant increased ratio of effector or memory CD8+ cytotoxic T cells. Previous studies revealed that the frequency of Tregs in patients with AA was lower than that in healthy controls. T-box expressed in T cells (T-bet) and Eomesodermin (Eomes) participate in regulating T cell differentiation and phenotype shift, but no significant differences were observed. To investigate whether calcineurin/nuclear factor of activated T cell (NFAT) pathways are related to the response, we further detected the expression of T-bet and Eomes (Fig 1).
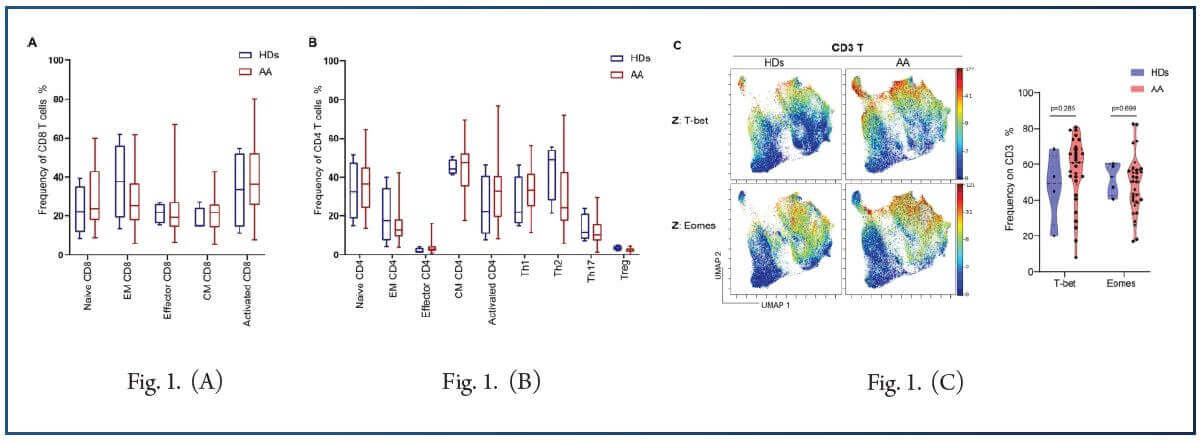
Taken together, data suggest that the frequency of T cell subpopulations and the expression level of T cell functional regulatory transcript factors are unrelated to the occurrence and development or the cyclosporine sensitivity of non-SAA which might be due to the heterogeneity of non-SAA. Additionally, the expression level of calcineurin/NFAT pathway could not discriminate the response to cyclosporine.
Cyclosporine treatment restores the expression of immune checkpoint molecule in responder patients
Immune checkpoint molecules play a critical role in the immune response of AA patients, with higher frequency of CTLA-4+ CD8+ T cells being found in AA (22.63 ± 2.11%, p < 0.05). However, no significant difference was observed between healthy controls and AA patients. Responders displayed a lower frequency of CD8+ at diagnosis, compared to non-responders (16.55% vs. 17.59% p =0.105). No statistically significant difference on PD-1+, LAG-3+, TIM3+, or TIGHT+ T cells was observed between the AA cohort and healthy volunteers.
T cell trafficking mediator is linked to cyclosporine response in AA
S1P1 receptor signaling is correlated with various physiological processes, including lymphocyte recirculation, their biology, and phenotype determination. To explore whether the expression of S1P1 has influence on immune function of T cells in AA, we compared the expression of the receptor on T cell subsets between healthy donors and AA. Results showed that increased expression of s1P1 on naive CD4+ T cells (27.02 ± 2.35% vs. 10.24%, p < 0.05) was observed in AA, and Central memory CD8+ T cells also showed an increased level of the receptor. Additionally, expression difference was observed between T helpers and Th2 subset, with Th2 subset having a higher level than T helpers. Additionally, patients with a lower level of S1Ps1 at diagnosis seem to be more prone to achieve response after cyclosporine, as compared to non-responder patients.
Expression of IL-9 is correlated to cyclosporine response in AA
IL-9/IL-9 receptor plays a dual effect on inflammation and autoimmune disease, including both pro-inflammatory and protective roles in occurrence of disease. We found that patients displayed a significant higher level of IL-9 on naive CD4+ T cells and Th2 cells in AA patients, suggesting that IL-9 may play a role in the pathophysiology of AA. To investigate the correlation between IL-9 expression prior treatment and cyclosporine response, we further analyzed the characteristics of naive T cells and T helper subsets. Results showed that responders had significantly lower expression of the IL-9 receptor compared to non-responder patients, and that Th17 clusters expressed lower levels of the receptor in responders than non-responders. This suggests that there is a significant association between the expression and clinical response.
Conclusion
In summary, the study showed the differences in T cell immune signature between AA and healthy individuals. More importantly, it was observed that cyclosporine restored the expression of CTLA-4 on T cells in responders. A lower level of S1P1 and IL-9 predicts a better response. Evaluation of targeting these T cell markers should be widely taken into consideration for the optimal management of AA taken into the future. Further studies focusing on immune checkpoint molecules, T cell trafficking, and secretion of IL-9 could provide us more information to do decision-making of cyclosporine treatment strategy.
References:
1. Brodsky RA, Jones RJ (2005) Aplastic anaemia. The Lancet 365(9471):1647–1656. https://doi.org/10.1016/s0140-6736(05)66515-4.
2. Young NS, Calado RT, Scheinberg P (2006) Current concepts in the pathophysiology and treatment of aplastic anemia. Blood 108(8):2509–2519. https://- doi.org/10.1182/blood-2006-03-010777.
3. Young NS, Scheinberg P, Calado RT (2008) Aplastic anemia. Curr Opin Hematol 15(3):162–168. https://doi.org/10.1097/MOH.0b013e3282fa7470.
4. Camitta BM, Rappeport JM, Parkman R, Nathan DG (1975) Selection of patients for bone marrow transplantation in severe aplastic anemia. Blood 45(3):355–363.
5. Bacigalupo A, Hows J, Gluckman E, Nissen C, Marsh J, Van Lint MT, Congiu M, De Planque MM, Ernst P, McCann S et al (1988) Bone marrow transplantation (BMT) versus immunosuppression for the treatment of severe aplastic anaemia (SAA): a report of the EBMT SAA working party. Br J Haematol 70(2):177–182. https://doi.org/10.1111/j.1365-2141.1988.tb02460.x.
6. Nishio N, Yagasaki H, Takahashi Y, Muramatsu H, Hama A, Yoshida N, Kudo K, Kojima S (2009) Natural history of transfusion-independent non-severe aplastic anemia in children. Int J Hematol 89(4):409–413. https://doi.org/10.1007/s12185-009-0302-9.
7. Kwon JH, Kim I, Lee YG, Koh Y, Park HC, Song EY, Kim HK, Yoon SS, Lee DS, Park SS, Shin HY, Park S, Park MH, Ahn HS, Kim BK (2010) Clinical course of non-severe aplastic anemia in adults. Int J Hematol 91(5):770–775. https://doi.org/10.1007/s12185-010-0601-1.
8. Young NS (2018) Aplastic anemia. N Engl J Med 379(17):1643–1656. https://doi.org/10.1056/NEJMra1413485.
9. Schrezenmeier H, Schlander M, Raghavachar A (1992) Cyclosporin A in aplastic anemia–report of a workshop. Ann Hematol 65(1):33–36. https://- doi.org/10.1007/bf01715123.
10. Scheinberg P, Young NS (2012) How I treat acquired aplastic anemia. Blood 120(6):1185–1196. https://doi.org/10.1182/blood-2011-12-274019.
11. Liu C, Sun Y, Shao Z (2019) Current concepts of the pathogenesis of aplastic anemia. Curr Pharm Des 25(3):236–241. https://- doi.org/10.2174/1381612825666190313113601.
12. Giannakoulas NC, Karakantza M, Theodorou GL, Pagoni M, Galanopoulos A, Kakagianni T, Kouraklis-Symeonidis A, Matsouka P, Maniatis A, Zoumbos NC (2004) Clinical relevance of balance between type 1 and type 2 immune responses of lymphocyte subpopulations in aplastic anaemia patients. Br J Haematol 124(1):97–105. https://doi.org/10.1046/j.1365-2141.2003.04729.x.
13. Solomou EE, Keyvanfar K, Young NS (2006) T-bet, a Th1 transcription factor, is up-regulated in T cells from patients with aplastic anemia. Blood 107(10):3983–3991. https://doi.org/10.1182/blood-2005-10-4201.
14. de Latour RP, Visconte V, Takaku T, Wu C, Erie AJ, Sarcon AK, Desierto MJ, Scheinberg P, Keyvanfar K, Nunez O, Chen J, Young NS (2010) Th17 immune responses contribute to the pathophysiology of aplastic anemia. Blood 116(20):4175–4184. https://doi.org/10.1182/blood-2010-01-266098.
15. Solomou EE, Rezvani K, Mielke S, Malide D, Keyvanfar K, Visconte V, Kajigaya S, Barrett AJ, Young NS (2007) Deficient CD4+ CD25+ FOXP3+ T regulatory cells in acquired aplastic anemia. Blood 110(5):1603–1606. https://doi.org/10.1182/blood-2007-01-066258.
16. Kordasti S, Marsh J, Al-Khan S, Jiang J, Smith A, Mohamedali A, Abellan PP, Veen C, Costantini B, Kulasekararaj AG, Benson-Quarm N, Seidl T, Mian SA, Farzaneh F, Mufti GJ (2012) Functional characterization of CD4+ T cells in aplastic anemia. Blood 119(9):2033–2043. https://doi.org/10.1182/blood-2011-08-368308.
17. Shi J, Ge M, Lu S, Li X, Shao Y, Huang J, Huang Z, Zhang J, Nie N, Zheng Y (2012) Intrinsic impairment of CD4(+)CD25(+) regulatory T cells in acquired aplastic anemia. Blood 120(8):1624–1632. https://doi.org/10.1182/blood-2011-11-390708.
18. Zhang J, Gu Y, Xu C, Qu X (2008) Increased T cell immunoglobulin mucin-3 and its ligand in acquired aplastic anemia. Eur J Haematol 81(2):130–139. https://- doi.org/10.1111/j.1600-0609.2008.01095.x.